Part two: what a 22-day illness arc, a recovery week crisis, and a 54km
simulation day taught me about preparing for a 17-day, 1,000km ultra-
marathon expedition
Where the first article ended
The first article in this series described the architecture of a daily physiological
monitoring system built for a specific purpose: preparing for a 1,000-kilometre, 17-day
ultra-marathon expedition. It covered the lactate threshold test that anchored the
training zones to real physiology, the morning protocol that generates a daily
readiness assessment, and the five initial lessons the data had produced — among
them, the ability to distinguish illness from fatigue and the discovery of specific
lifestyle factors that produce predictable, quantifiable disruption to overnight HRV.
That article was written from a position of relative optimism. The monitoring system
was working. The training was progressing. The data was clean and the patterns were
clear.
Then the illness arrived.
What followed was 22 days of the most demanding data interpretation of the entire
preparation — not because the numbers were difficult to read, but because reading
them correctly while also wanting to train required a discipline that the monitoring
system had never been tested to provide. This article covers what happened, what it
revealed, and what a 54-kilometre simulation day ultimately confirmed about the
fitness that had been built beneath the disruption.
” What followed was 22 days of the most demanding data interpretation of the entire
preparation …“
The illness arc: 22 days of data that changed the protocol
The illness began without fever. That single fact made it harder to manage than a
straightforward viral infection with a clear temperature reading. Morning HRV data —
specifically the pNN50 metric, which measures the percentage of successive
heartbeat intervals differing by more than 50 milliseconds — collapsed from a healthy
baseline of approximately 12 percent to 1.35 percent across three days. The stress
index, a composite measure of autonomic nervous system loading derived from the
full RR interval recording, climbed to levels that exceeded any previous reading in the
dataset.
The subjective experience did not match the data severity. There was fatigue, but no
dramatic systemic symptoms. Without the monitoring, this would almost certainly have
been trained through — and based on the data, training through it would have been a
significant mistake.
| Metric | Healthy baseline | Illness trough |
| pNN50 morning | ~12% | 1.35% |
| Stress index | 10–11 | 20.35 |
| RMSSD (morning window) | ~19–26ms | 14–15ms |
| Whoop RHR | 42–43 bpm | 47–48 bpm |
| Ortho HR peak delta | +20–23 bpm | +34–39 bpm |
What made the illness arc genuinely difficult to manage was the pattern of apparent recovery followed by rebound. Four times across the 22-day period, morning metrics improved to the point where returning to training seemed physiologically supported — and four times, training on the day of apparent clearance produced a rebound the following morning that extended the suppression by 48 to 72 hours. The pattern was consistent enough to generate a specific rule that is now permanently embedded in the field guide: one clearance reading is not clearance. Two to three consecutive clearance readings are required before any training above Z1 intensity.
“Four times across 22 days, training on the day of apparent clearance produced a rebound that extended the suppression by two to three days. The data taught a rule that no training plan had ever specified.”
The rebound pattern also clarified something important about what the monitoring system is actually measuring. Stress index, RMSSD, and overnight Whoop recovery are not measuring fitness. They are measuring the body’s systemic load — the total demand being placed on the autonomic nervous system from all sources simultaneously. During an active immune response, the immune system and the training stimulus compete for the same recovery resources. Adding a training session to an incompletely resolved immune response does not produce adaptation. It produces exactly what the data showed: a rebound.
This understanding is not new to exercise physiology. But it is one thing to know it academically and another to watch it express in your own data four times in three weeks.
What the devices actually measure: a recalibration
The illness arc produced a secondary discovery that significantly changed the morning protocol. Across multiple weeks of daily measurement, a consistent divergence emerged between the Kubios RMSSD reading taken in the immediate waking window and the Elite HRV RMSSD reading taken after a longer period of lying still. On a morning where the Kubios window showed RMSSD at 15 milliseconds, the Elite HRV measurement taken 5 to 10 minutes later showed RMSSD at 35 milliseconds.
The explanation is the waking transition sympathetic surge — the acute cortisol and adrenaline response that occurs in the first several minutes after waking. This surge is normal physiology. It happens every morning. But if an HRV measurement is taken within two to three minutes of waking, it captures the sympathetic activation rather than the true resting parasympathetic state. The result is an RMSSD reading that systematically underestimates recovery.
Across the illness arc, this meant that the Kubios morning readings — taken in the immediate waking window — were showing RMSSD values of 14 to 17 milliseconds, suggesting near-clinical autonomic suppression, when the true daytime resting RMSSD was approximately 35 milliseconds. The illness was real. The suppression was real. But the absolute severity, as measured by the morning Kubios window, was being inflated by the measurement timing.
| Measurement | RMSSD reading |
| Kubios — immediate waking window | 14–17ms (illness period) |
| Elite HRV — after 5+ min stillness | 35–40ms (same mornings) |
| Midday Elite HRV — daytime settled state | 35–39ms |
| Pre-illness true resting estimate | 35–40ms |
The practical consequence of this discovery was a protocol revision. The Elite HRV measurement, taken after a minimum of five to eight minutes of lying completely still, replaced the immediate Kubios RMSSD as the primary morning RMSSD reference. Kubios remained in the protocol for its stress index and PNS/SNS index measurements, which are derived from the full recording window and are less sensitive to the acute waking transition. The overnight Whoop recovery score, which measures HRV continuously throughout sleep and is entirely unaffected by waking transition effects, was elevated to primary overnight indicator status.
This recalibration changed the device trust hierarchy from what had been described in the first article:
| Device / metric | Role in revised protocol |
| Whoop overnight recovery % | Primary overnight indicator — continuous · no waking artefact |
| Elite HRV RMSSD (5+ min wait) | Primary morning RMSSD — after waking transition resolves |
| HRV4Training ortho protocol | Ortho HR peak delta · HRV rest · standing recovery |
| Kubios stress index | Multi-day trend only · not single-day decisions |
| Apple Watch SDNN | Overnight cross-check · secondary |
“The device trust hierarchy that seemed settled after the first article was wrong. The illness forced a recalibration that improved measurement accuracy for every morning that followed.”
The recovery week that almost wasn’t
Following the illness arc, a structured recovery week was prescribed. The plan on paper was 300 to 400 total stress score units across seven days of exclusively easy aerobic work — no threshold sessions, no VO2 max work, no back-to-back long efforts. The purpose was straightforward: restore the autonomic nervous system baseline before the final build block before the expedition.
The first version of the recovery week plan, as delivered by the training platform, showed 985 TSS — nearly matching the planned peak build week. This was not a coach error so much as a system error: the training platform had been built around the assumption of a healthy athlete who had completed the planned build block 1 in full. The illness arc had produced actual TSS of approximately 40 percent of planned. The platform did not know this. It continued prescribing load as if the base had been built.
After sharing the morning data with the coach alongside a clear explanation of the illness arc and its rebound pattern, the recovery week was restructured to 300 to 400 TSS with strict intensity caps. No threshold work until HRV normalised. No VO2 max work until two consecutive mornings above the clearance thresholds. The coach’s response was immediate and well-reasoned — exactly the collaboration the monitoring system was designed to enable.
The recovery week itself produced two findings that were not anticipated.
Finding one: S&C sessions suppress overnight RMSSD recovery
Even 30-minute strength and conditioning sessions, executed at moderate load and well within any cardiovascular threshold, were sufficient to prevent the overnight RMSSD from recovering toward baseline. On days with S&C sessions, the following morning’s Elite HRV RMSSD plateaued at 18 to 21 milliseconds. On days with complete rest — no running, no S&C, only a cold water immersion session — the following morning’s Elite HRV RMSSD jumped to 47.97 milliseconds, the highest reading in the entire dataset.
This is not an argument against S&C training. It is a calibration of what S&C costs in recovery terms during a period when the primary goal is autonomic restoration. For expedition preparation specifically, it changes the rest day protocol: genuine rest means no structured exercise of any kind, including strength work.
Finding two: the supercompensation signature is identifiable
The jump from 18 milliseconds to 47.97 milliseconds overnight was the first supercompensation expression in the dataset. It was followed three days later by a Whoop recovery of 97 percent, a Kubios stress index of 10.73 — the lowest in the dataset and below the pre-illness baseline — and an orthostatic HR peak delta of positive 19 beats per minute, below even the established clean range. All four readiness apps reported their highest scores simultaneously.
Supercompensation — the physiological overshoot above baseline that follows adequate recovery from a significant training stimulus — is discussed frequently in endurance sport. Seeing it expressed in my own specific metrics with its exact numerical signature is a different experience. It confirmed that the monitoring system could detect not just suppression and recovery but the full arc from loading to adaptation.
| Date | Elite HRV RMSSD | Whoop recovery | Context |
| Post-illness trough | 14–17ms | 46–57% | Illness active |
| Recovery week day 3 | 47.97ms | 70% | Supercompensation peak |
| Recovery week day 6 | 18.73ms | 90% | Post two-session days |
| Simulation eve | 17.99ms | 95% | After full rest day |
The measurement that changed everything: midday RMSSD
One afternoon during the illness period, an Elite HRV measurement was taken at midday — not as part of the standard morning protocol but as a diagnostic check. The result was RMSSD 35 milliseconds. The same morning’s Kubios window had shown RMSSD 15 milliseconds.
This single reading was the most clarifying data point of the entire monitoring period. It demonstrated conclusively that the body’s true daytime resting autonomic state was essentially normal — comparable to pre-illness baseline — while the morning measurement window continued to show suppression. The illness was primarily affecting the overnight recovery process and the acute waking window, not the daytime parasympathetic tone.
In practical terms this meant that decisions made purely from the morning Kubios RMSSD were systematically overstating the physiological barrier to training. The true question was not whether RMSSD was 15 or 35 milliseconds in absolute terms — it was which reading more accurately reflected the body’s capacity for the day’s planned work. A midday RMSSD of 35 milliseconds on a morning where Kubios showed 15 milliseconds suggested the body could handle more than the morning window implied, provided the activity was undertaken after the waking transition had fully resolved.
This has become a standard part of the diagnostic toolkit for ambiguous mornings: when the morning RMSSD is low but Whoop shows adequate recovery and the ortho protocol shows normal autonomic flexibility, a midday Elite HRV measurement arbitrates. If it shows RMSSD recovering toward 30 milliseconds or above, the morning suppression was measurement-window-driven. If it stays suppressed at midday, the overnight state genuinely requires more recovery time.
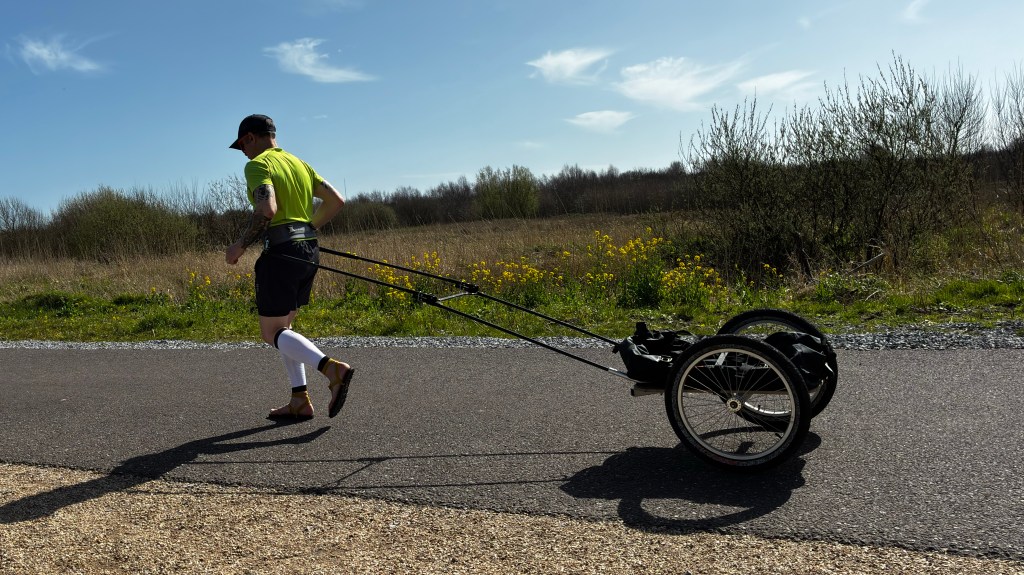
The simulation day: seven hours, 54 kilometres, 30kg
The simulation day had been postponed three times before it finally happened. The first attempt was prevented by the illness arc still being active. The second was prevented by a rebound from a late evening meal the night before. The third was prevented by accumulated cycling load during a commuter week that had suppressed RMSSD to its lowest morning value.
When the simulation day finally ran, it began from the best morning data in weeks. Whoop reported 95 percent recovery — a supercompensation reading. The orthostatic HR peak delta was positive 17 beats per minute, below even the established clean range of plus 20 to 23 beats per minute, the lowest in the entire dataset. The Kubios stress index had dropped to 10.73 — matching the pre-illness baseline from before the entire disruption period. The body had arrived at the simulation day in genuine peak condition.
| Simulation day metric | Value |
| Total moving time | 7 hours 6 minutes |
| Total distance | 54 kilometres |
| Trailer weight | 30kg throughout |
| AM session decoupling | 3.9% → 5.1% across 3.5 hours |
| PM session decoupling | 0.0% across 3 hours 44 minutes |
| Maximum HR across day | 144 bpm — below LT1 |
| Z3 time total | Zero |
| Body weight change | Zero — perfect hydration |
The AM session produced decoupling that rose from 3.9 percent in the first hour to 5.1 percent across 3.5 hours — the expected pattern of cardiovascular drift accumulating with duration and load. The maximum HR of 144 beats per minute was 6 beats below the aerobic ceiling established by the lactate test. The entire AM session was completed without breaching Zone 1.
The PM session, begun after a three hour between-session gap with structured recovery nutrition, produced 0.0 percent decoupling across 3 hours and 44 minutes. Zero cardiovascular drift across the longest single session of the preparation period, on fatigued legs, with 30 kilograms on the trailer, after 3.5 hours of running that same morning.
The 0.0 percent decoupling figure is the single most important performance data point produced in this entire preparation. It confirms that the aerobic base built through the early months of training — base that the illness temporarily obscured but did not destroy — is calibrated for exactly the kind of sustained demand the expedition requires. The body knows how to work at this load. The efficiency is built in.
“Zero percent cardiovascular drift across 3 hours 44 minutes on fatigued legs with a 30kg trailer. The aerobic base the illness obscured was still there.”
What the fuelling data produced
The simulation day also validated the on-the-move nutrition protocol. Two scoops of a specialist carbohydrate drink per 500ml bottle, one bottle per hour, combined with a solid sports bar every 20 minutes, produced approximately 70 grams of carbohydrate per hour — within the target range of 60 to 75 grams. Body weight was identical at the end of the day as at the start, confirming that fluid intake matched sweat rate precisely across 7 hours of loaded movement.
The appetite suppression that appeared after approximately 3.5 hours of continuous effort is the expected physiological pattern. Blood is redirected from the digestive system to working muscle during sustained aerobic exercise, reducing appetite signals and slowing gastric emptying. Continuing to eat to the protocol rather than to hunger — consuming bars every 20 minutes despite no subjective desire for food — is the specific behaviour that the simulation day practised and confirmed as executable. On expedition days 10 through 14, when appetite suppression will be deeper and more persistent, this practised behaviour is the difference between adequate fuelling and a progressive caloric deficit that compounds across the final week.
The day-2 simulation: what the body looks like after a full expedition stage
The morning after the simulation day produced the data that the entire exercise was designed to generate. After 7 hours of loaded running and 54 kilometres of movement, the overnight recovery profile showed Whoop recovery at 25 percent — the lowest in the dataset. The Whoop overnight heart rate trace showed cardiac rate at 65 beats per minute at sleep onset, declining to 44 beats per minute over approximately 5.5 hours as the cardiovascular system worked through the night to restore its resting state.
This overnight cardiac recovery arc — from 65 beats per minute to baseline across 5.5 hours — is the expedition overnight profile. It will happen every night from day 1 onward. The Whoop 25 percent reading does not mean the body cannot function the following day. It means the following day must be managed within the expedition tier system: heart rate ceiling reduced, uphills walked earlier, fuelling increased above normal targets, and pace dictated entirely by HR rather than any target pace or distance.
The day-2 simulation run proceeded at Tier 1 pace — and proceeded successfully. The body continued moving efficiently at controlled heart rate even at 25 percent Whoop recovery. This is the most important expedition-specific finding of the simulation weekend: a Whoop reading of 25 percent after a full stage day does not mean the expedition is failing. It means the next stage requires Tier 1 management, not crisis intervention.
| Expedition tier | Trigger | HR ceiling | Key behaviour |
| Tier 1 — modified normal | Stress >15 · RMSSD amber · temp normal | 125 bpm | Hike uphills early · +20% fuelling |
| Tier 2 — damage limitation | Stress >18 · RMSSD red · or low-grade temp | 115 bpm | Walk/jog flat only · max fuelling |
| Tier 3 — medical awareness | Confirmed fever >37.5°C | 110 bpm walk | Medical awareness active |
The device stack: what survived the scrutiny
The monitoring stack that entered the illness arc was more complex than the one that emerged from it. Through 22 days of daily measurement across multiple devices, the data quality and reliability hierarchy became clear in a way that no amount of theoretical evaluation could have produced.
Whoop’s continuous overnight measurement proved consistently the most reliable recovery indicator. Its algorithm captures the full overnight autonomic arc rather than a snapshot measurement window. When Whoop and other metrics diverged — as they did repeatedly during the illness — Whoop’s reading more reliably reflected the actual physiological state as confirmed by subsequent training performance. On the simulation day morning, Whoop reported 95 percent recovery. The subsequent 7-hour, 54-kilometre effort at controlled heart rate with zero Zone 3 time confirmed that reading was accurate.
The HRV4Training orthostatic protocol — specifically the HR peak delta on standing — emerged as the most sensitive single-morning indicator of autonomic state. It is taken after the waking transition has resolved, it requires no special positioning or extended stillness beyond the supine phase, and it proved remarkably consistent in distinguishing lifestyle-disrupted mornings from genuinely suppressed physiological states. An ortho HR peak delta of positive 19 beats per minute on simulation day morning was the clearest green light the dataset has produced.
Kubios remains in the protocol for its stress index trend value across multiple days. But single-day Kubios RMSSD readings from the immediate waking window have been formally downgraded to secondary status. The measurement timing sensitivity is too high for the absolute value to be trusted on any individual morning.
What the preparation has confirmed: five months to expedition start
Writing this in the final weeks before a 1,000-kilometre expedition begins, the monitoring data has produced several confirmations that would have been assertions rather than evidence without it.
The aerobic base is calibrated for expedition load. The simulation day’s 0.0 percent PM decoupling at 30 kilograms is not a statistical accident. It is a repeatable expression of an aerobic system that has been trained over months to operate efficiently at exactly the heart rate and power output the expedition demands. The illness disrupted the training timeline but not the underlying aerobic adaptation.
The fuelling protocol is validated and executable. Seventy grams of carbohydrate per hour through a combination of liquid carbohydrate and solid bars every 20 minutes is achievable, gut-tolerable, and sufficient to maintain body weight across a 7-hour loaded day. The appetite suppression that arrives after hour 3 does not prevent eating to protocol — which is the behaviour that matters.
The monitoring system produces actionable intelligence in conditions where intuition fails. The illness arc would have been trained through without the data. The rebound pattern would have been repeated until the illness either resolved on its own or became serious. The recalibration of the morning measurement protocol would never have happened without the midday Elite HRV reading that exposed the waking transition artefact. Every significant decision improvement across this preparation has been data-driven rather than feel-driven.
The expedition tier system has been calibrated to real physiological data rather than generic guidelines. The Tier 1 and Tier 2 thresholds are not round numbers from a sports science textbook. They are derived from 60-plus days of daily morning measurement, four illness rebounds, one recovery week, and one simulation day that produced a concrete post-stage ANS profile.
And perhaps most importantly: the data has consistently shown that the body’s capacity exceeds what the morning metrics suggest on any individual day. A Whoop reading of 25 percent did not prevent 20 kilometres of efficient running the following morning. A stress index of 17 did not prevent a negative 2 percent decoupling trailer session. The metrics are a guide to how to manage the day, not a ceiling on what is physically possible. Understanding that distinction — after months of daily data — is the most practically useful thing the monitoring system has produced.
The unknown that remains
One data point that no amount of simulation can fully replicate is what happens to the monitoring metrics across 17 consecutive days of expedition load. The simulation day showed what day 1 and day 2 look like. It cannot show what day 12 looks like — the accumulated suppression, the compressed baselines, the morning metrics reading values that would be concerning at home but are normal for the physiological state of an athlete 11 stages into a 1,000-kilometre journey.
The field guide prepared for the expedition addresses this directly. From approximately day 5 onward, the rolling 7-day average replaces the home baseline as the reference point for all metric interpretation. A stress index of 16 on expedition day 10, compared against a rolling average of 15 across the preceding week, is a one-point elevation — amber, not red. The same stress index of 16 compared against a home baseline of 11 would read as red. Context determines interpretation. The monitoring system is only as useful as the contextual framework applied to it.
The expedition begins in five weeks. The preparation is as complete as 60-plus days of daily data, one simulation day, and a 22-day illness arc can make it. The aerobic system is calibrated. The monitoring protocol is validated. The tier system is tested. The fuelling protocol works.
What remains is the expedition itself — and the data it will produce each morning before any of it begins.
About this article
This is the second in a series of articles documenting the preparation for a 1,000-kilometre, 17-day multi-stage ultra-marathon expedition. All physiological data, training metrics, and monitoring results are drawn from the author’s personal preparation logs. Individual names, identifying details, specific locations, and identifying route information have been anonymised or removed. The monitoring protocols described reflect a personal preparation system developed in collaboration with coaching support and are not intended as medical or clinical guidance. Anyone considering physiological monitoring of this kind should consult with a qualified sports physician or exercise physiologist before making training decisions based on HRV or related metrics.

Leave a comment